Beyond ROAS what actually matters
Plus, 📄Design meets data in Canva Sheets

Hello Readers 🥰
Welcome to today's edition, bringing the latest growth stories fresh to your inbox.
If your pal sent this to you, then subscribe to be the savviest marketer in the room😉
In Partnership with Money
Car insurance costs are set to reach record highs in 2025.
Are you ready? Shop around and compare policies by checking out Money's Best Car Insurance list.
Build a Smarter Metrics Dashboard
Still relying on Blended ROAS to measure success? You might be flying blind. While it’s simple to calculate, Blended ROAS often masks the true cost of acquiring new customers. That’s why savvy brands are moving toward more meaningful financial metrics that reflect actual performance and long-term health.
Here’s how to evolve your metrics approach:
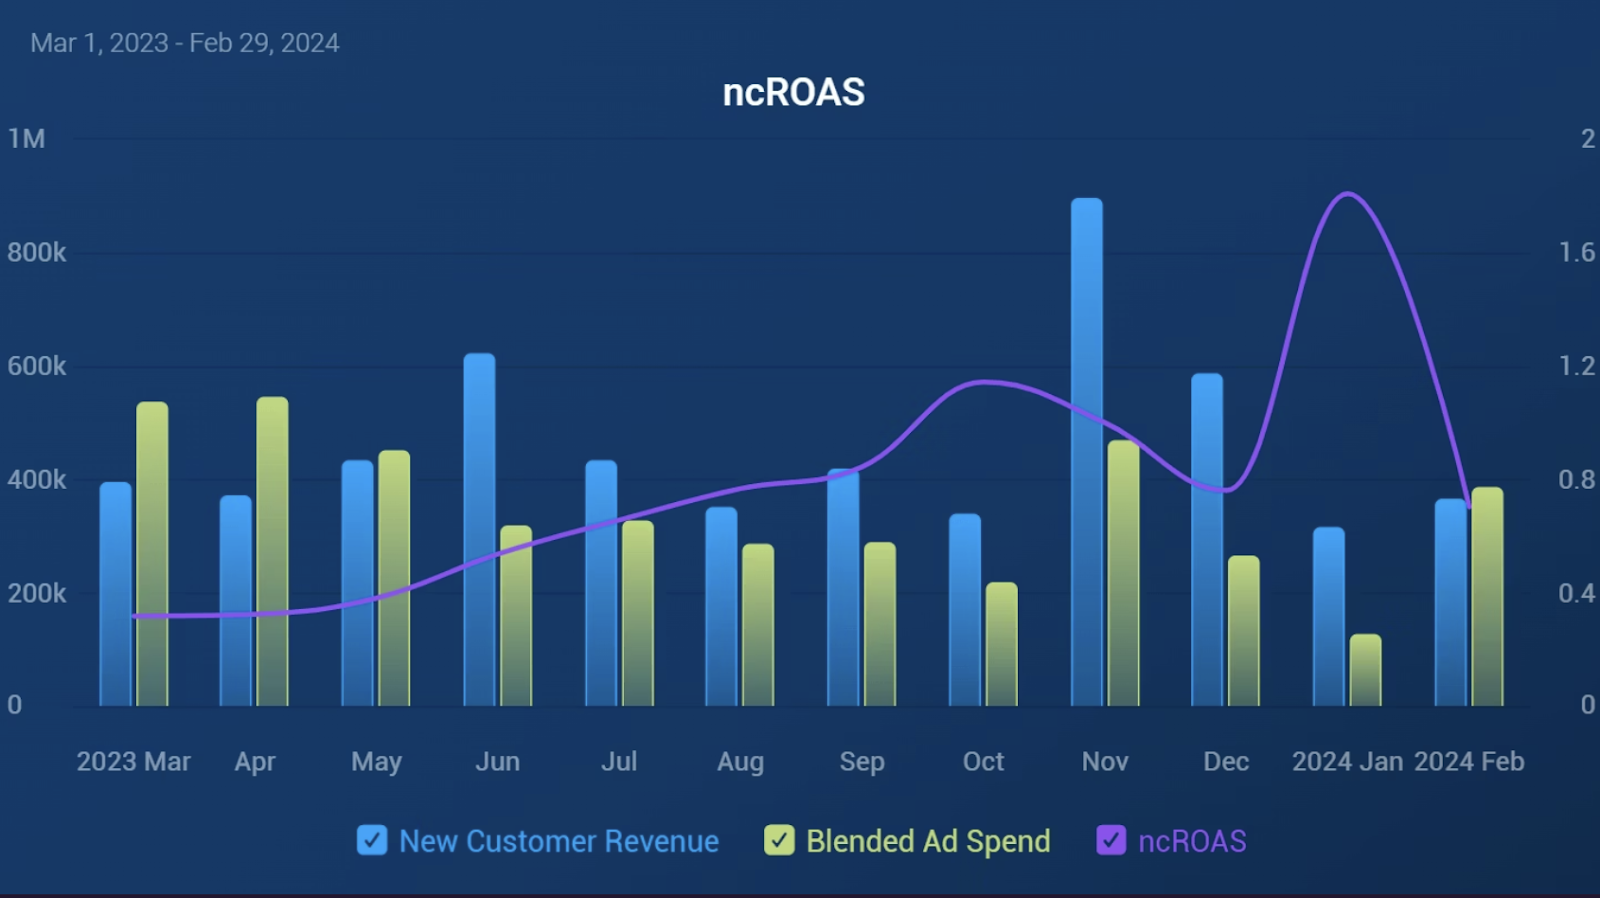
Step 1: Track New Customer ROAS (ncROAS):
Formula: New Customer Revenue ÷ Total Ad SpendThis shows how well your ad dollars are driving net-new buyers. If your ncROAS isn’t at break-even, your paid acquisition might be unsustainable unless you’re confident in your retention data and have strong cash reserves.
Step 2: Understand Your Inventory Health:
Start monitoring Days Inventory On Hand (DIO):Formula: (Avg. Inventory ÷ COGS) × DaysIt tells you how long your stock sits before selling. Long DIO = tied-up cash and risk of loss. Adjust based on product type, seasonality, and storage costs.
Step 3: Check Your Liquidity Ratios:
Use Current Ratio and Quick Ratio to assess short-term financial stability.Quick Ratio excludes inventory, so you know if you can meet obligations without moving product.Benchmarks: Current Ratio above 1.5, Quick Ratio above 1.0.
Step 4: Measure Contribution Margin by Channel:
Compare net revenue minus variable costs across DTC, Amazon, wholesale, and more. You’ll uncover which channels are profitable and can prioritize spend where margins matter.
The Takeaway
Blended ROAS is just the surface. To scale smartly, track ncROAS, margin per order, and inventory metrics in real time. These aren’t just finance metrics, they’re strategic tools for every team.
Build Smarter Sheets with Canva
Say goodbye to boring spreadsheets. Canva Visual Suite 2.0 introduces Sheets, a new AI-powered tool that turns raw numbers into smart, stylish data with just a few clicks. Whether you’re managing budgets, campaigns, or content calendars, this upgrade makes spreadsheets faster and easier than ever.
Steps to Create Smart Spreadsheets Using Canva Sheets:
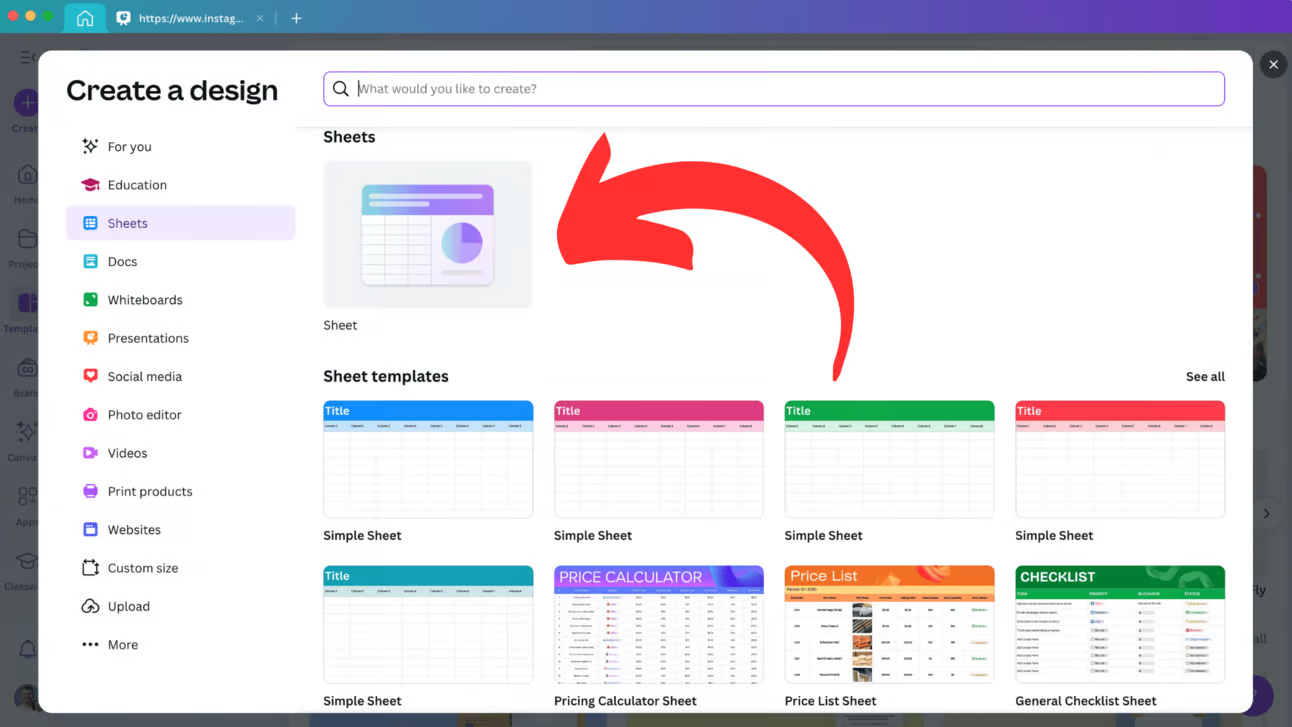
1️⃣ Open Canva and Choose “Sheets” :
Head to your Canva dashboard, click “Create,” and pick “Sheets” from the dropdown.
2️⃣ Start with a Template or Blank Page:
You can begin from scratch or pick a pre-designed layout for common needs like marketing calendars or budget trackers.
3️⃣ Use Magic Fill to Complete Patterns:
Highlight your data, right-click, and choose “Magic Fill.” Canva’s AI will detect patterns and auto-complete the rest, saving you time and clicks.
4️⃣ Ask Questions with Magic Insights:
Highlight your dataset and click “Magic Insights.” Ask natural questions like “Total monthly spend?” or “Top performing channels?” and get instant answers.
The Takeaway
Canva Sheets brings the power of design and automation into your everyday data work. From trend insights to smart completion, this tool is perfect for creators and marketers who want clarity without complexity. Give it a try and turn those rows and columns into actionable visuals.
We'd love to hear your feedback on today's issue! Simply reply to this email and share your thoughts on how we can improve our content and format.
Have a great day, and we'll be back again with more such content 😍